sales@wildnetedge.com
 +1 (212) 901 8616
 +1 (437) 225-7733


 ChatGPT Development & Enablement
  Hire AI & ChatGPT Experts
  ChatGPT Apps by Industry
  ChatGPT Blog
  ChatGPT Case study
  AI Development Services
  Industry AI Solutions
  AI Consulting & Research
  Automation & Intelligence


TL;DR
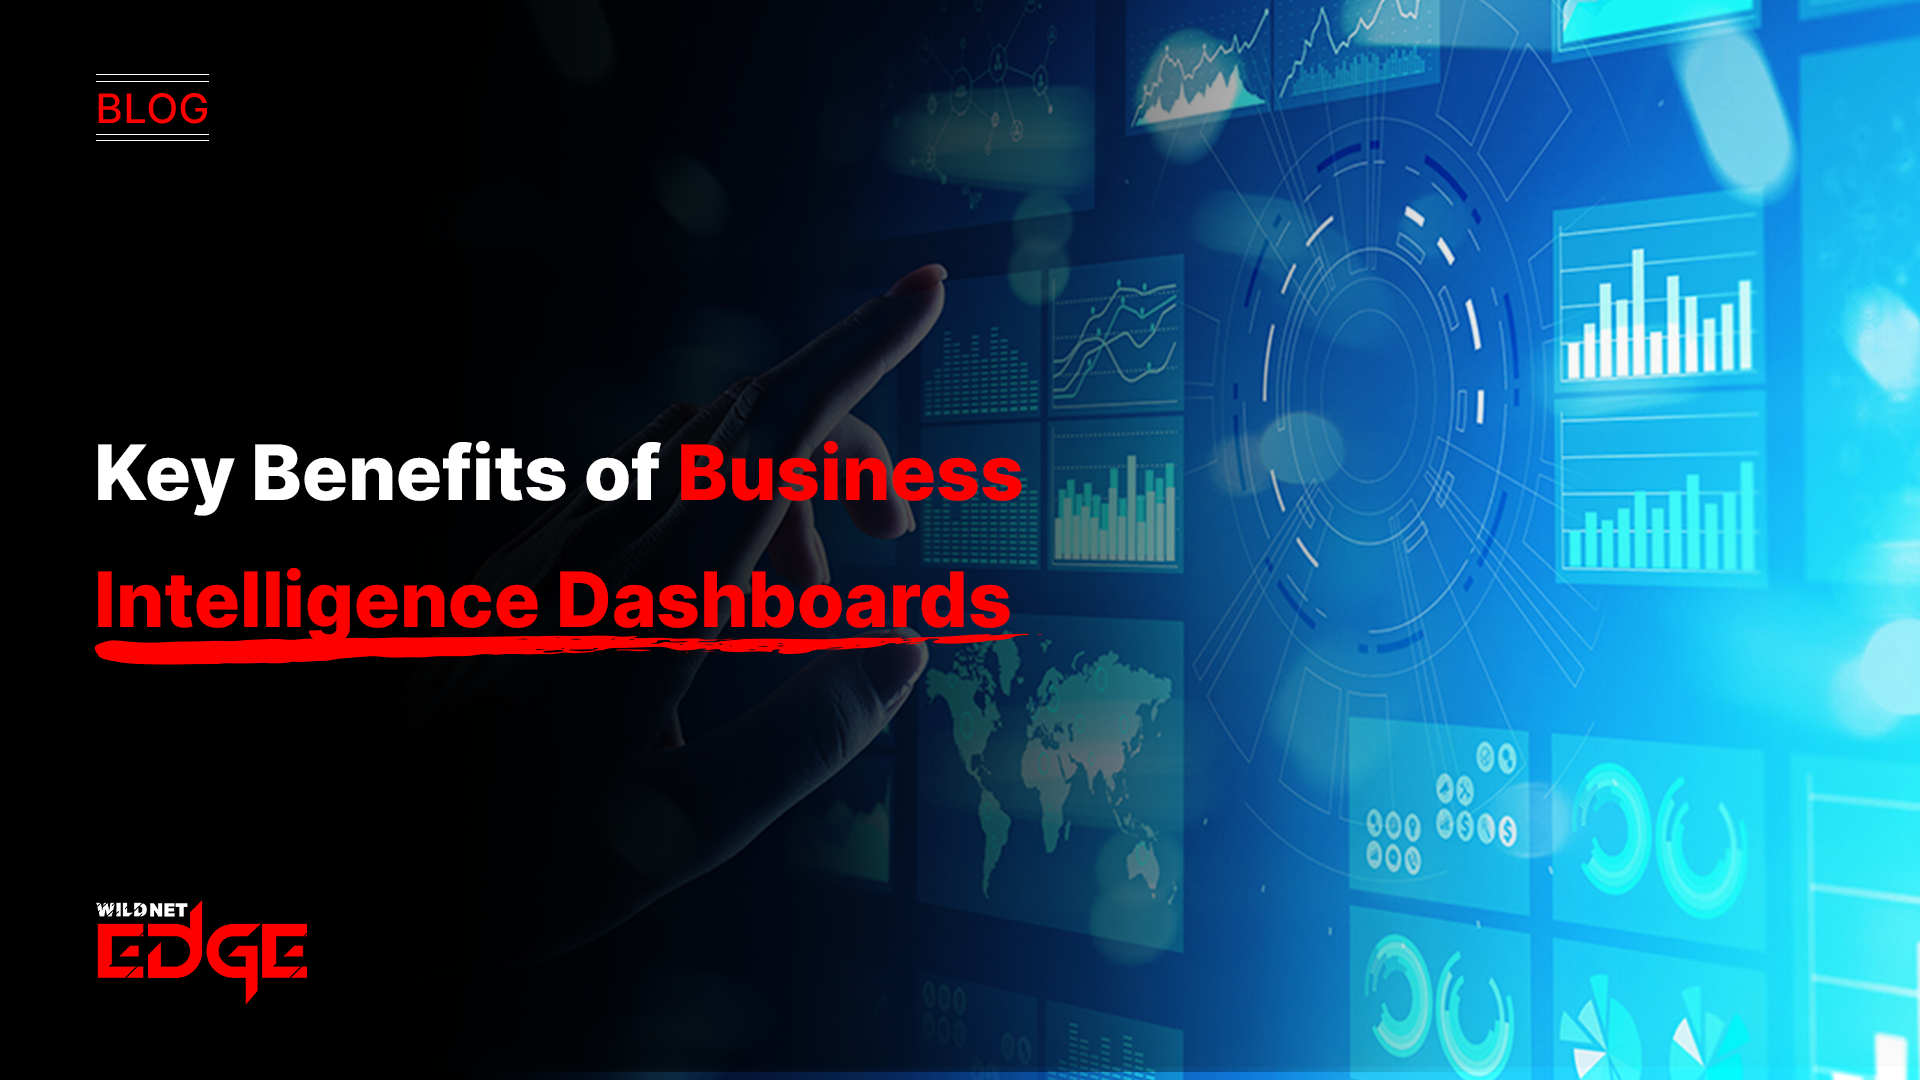
Business Intelligence Dashboards have become essential tools for companies in 2026. They turn raw data into clear visuals, help teams make decisions faster, and give leaders real-time visibility into what’s happening across the business. With modern analytics dashboards, organizations get predictive insights, automated reporting, and user-friendly data visualization tools that anyone can use without being a data expert. Whether you need better financial control, customer insights, or operational clarity, BI dashboards offer a practical way to break silos and act quickly. This guide explains the key benefits and real examples of how these tools improve performance and support long-term growth.
Companies today generate more data than ever—customer behavior, supply chains, sales activity, support tickets, marketing performance, and internal operations. But data alone doesn’t help anyone. Teams need a simple way to see what matters and act on it. That’s why Business Intelligence Dashboards have become such a critical part of modern operations.
Instead of digging through spreadsheets or waiting weeks for reports, teams can now open a dashboard and instantly understand what’s working, what’s slipping, and what needs attention. These dashboards pull data from across the organization and turn it into visuals people can understand at a glance. With strong data visualization tools, predictive analytics, and real-time tracking, BI dashboards make decision-making faster, clearer, and more accurate.
This guide walks through the core benefits of analytics dashboards, the BI dashboard features shaping 2026, and how companies are using them to improve performance and uncover meaningful business insights.
1. The Evolution of Decision-Making
The primary benefit of Business Intelligence Dashboards is the acceleration of decision-making. In a traditional setup, decisions are often reactive, based on historical data that is weeks or months old.
From reacting to anticipating
In the past, leaders relied on reports that were days or weeks old. Today, dashboards give real-time snapshots and predictive forecasts. With AI built into many tools, businesses can see:
- Sales trends forming before they peak
- Supply chain delays before they hit
- Customer churn risks before they escalate
This shift from “What happened?” to “What will happen?” is what gives companies a competitive edge.
Single Source of Truth
Data silos slow teams down. BI dashboards unify marketing, sales, finance, operations, and support data into one clean view. Instead of debating whose spreadsheet is correct, everyone works with the same numbers, instantly improving alignment and accountability.
2. Enhanced Data Visualization and Accessibility
People understand visuals faster than text or tables. That’s why data visualization tools are the core of every strong dashboard.
Data for everyone, not just analysts
Modern dashboards let business users explore data without relying on IT. They can:
- Create custom views
- Filter trends
- Drill into details
- Compare metrics instantly
This accessibility empowers teams to make decisions on their own, reducing bottlenecks.
Storytelling with Data
The application of visual elements such as heatmaps, scatter plots, and interactive charts has made it possible to change complicated data into easily comprehensible insights. The visualization of patterns, outliers, and trends has become so easy that the use of visual aids in presentations and strategizing has become effective beyond measure.
3. Operational Efficiency and Real-Time Monitoring
Efficiency is the ratio of useful work to resources spent. Analytics dashboards are the ultimate efficiency engines.
Real-Time KPI Tracking
Operational dashboards give a quick overview of the business’s overall status. Production facilities rely on them for real-time monitoring of machine uptime; customer service centers rely on them for observing waiting times and resolution rates. Besides showing in real-time dashboarding of Key Performance Indicators (KPIs), these tools enable the managers to take action the instant a metric goes out of the norm, thus stopping small troubles from turning into large crises.
Automating Routine Reporting
No more manual spreadsheets. BI dashboards generate and deliver reports automatically, and they send alerts when key thresholds are crossed. This saves hours each week and ensures decision-makers always have the latest information.
4. Advanced BI Dashboard Features in 2026
The capabilities of these systems have expanded dramatically. To stay competitive, organizations must leverage the latest BI dashboard features.
- Natural Language Processing (NLP): Users can now query their data using plain English (e.g., “Show me sales in Q3 by region”). This feature lowers the barrier to entry significantly.
- Embedded Analytics: BI dashboard features now allow for charts and graphs to be embedded directly into other applications like CRMs or ERPs, placing data exactly where work happens.
- Mobile-First Design: Modern analytics dashboards are fully responsive, ensuring that executives can access critical business insights on their smartphones while traveling.
5. Improving Customer Satisfaction
While often viewed as internal tools, Business Intelligence Dashboards have a direct impact on the customer experience.
A full view of every customer
By connecting support tickets, purchase history, and behavior data, dashboards reveal the complete customer journey. Support and marketing teams can personalize experiences and respond before issues grow.
Predicting customer needs
With strong business insights, BI companies can anticipate buying patterns, run targeted campaigns, and improve retention efforts.
6. Financial Management and Cost Control
Financial health is the bedrock of business continuity. Business Intelligence Dashboards offer unparalleled visibility into the bottom line.
Detailed expense tracking
Dashboards help finance teams identify waste, optimize budgets, and uncover unexpected spending patterns.
Reliable cash flow forecasting
With predictive modeling, teams can test scenarios, plan risks, and maintain financial stability.
7. Competitive Benchmarking
You do not operate in a vacuum. Visual analytics can integrate external market data to benchmark performance against competitors.
- Market Share Analysis: Visualizing your market position relative to key rivals.
- Sentiment Analysis: Using business insights BI to compare brand sentiment on social media against competitors.
- Price Monitoring:Reporting platforms can track competitor pricing changes in real-time, allowing for dynamic pricing strategies.
Case Studies: BI in Action
Case Study 1: Retail Chain Inventory Optimization
- The Challenge: A national retail chain faced recurring stockouts during peak seasons and overstocking during off-peak months, leading to a 15% loss in potential revenue. Their legacy spreadsheets could not handle real-time inventory tracking across 200 locations.
- The Solution: We implemented a centralized Business Intelligence Dashboard integrating POS data, warehouse levels, and historical sales trends. The solution utilized predictive BI dashboard features to forecast demand per region.
- The Result: Stockouts were reduced by 40%, and carrying costs dropped by 12% within the first quarter. The visual heatmaps allowed regional managers to redistribute stock instantly, optimizing the supply chain.
Case Study 2: Healthcare Patient Flow Management
- The Challenge: A large hospital network struggled with long patient wait times in the ER, impacting patient satisfaction scores.
- The Solution: A real-time operational dashboard was deployed. It visualized patient intake, bed availability, and staff schedules on large screens in the command center using advanced data visualization tools.
- The Result: Patient wait times decreased by 25%. Hospital administrators could allocate nursing staff dynamically based on live influx data, significantly improving operational efficiency.
Choosing the Right Approach
Implementing Business Intelligence Dashboards is not a “set it and forget it” project. It requires a strategic partner. Whether you need a custom solution or integration with existing tools, working with a specialized data analytics company ensures that your dashboards are built on a solid data foundation. Furthermore, professional dashboard development focuses on user experience (UX), ensuring that the final product is intuitive and widely adopted by your team.
Conclusion
In 2026, data isn’t optional; it’s a strategic asset. Business Intelligence Dashboards give companies the clarity they need to move with confidence. They turn overwhelming data into simple visuals, automate reporting, and empower teams with insights they can act on immediately.
As AI reshapes the way dashboards work from predictive analytics to natural language search, the value of strong visualization will only grow. The organizations that win will be those that embrace data as a daily decision-making tool, not a monthly reporting task.
If you are looking for a company that gives you a faster solution, then you can partner with Wildnet Edge. Our AI-first approach enhances your dashboard development capabilities, ensuring that your data tells a compelling and accurate story. As a premier data analytics company, we combine deep technical expertise with strategic insight. Leverage our BI development services to build solutions that illuminate the path to success.
FAQs
The primary objective is to transform intricate data sets into visual, comprehensible insights. They give the top management the possibility to observe the KPIs live, point out the trends, and very quickly make the choices that are strategic and based on knowledge.
Traditional reports are fixed, past-period documents usually created by hand. Analytics dashboards are the opposite: they are vibrant, interactive, and are constantly being updated with real-time data. Besides, users can perform data drilling and scenario testing, thus receiving, in fact, a lot more value compared to the traditional static reporting.
The main characteristics are real-time data updates, mobile-friendliness, customizable widgets, drill-down capabilities, and AI-driven insights such as anomaly detection and forecasting.
Definitely, although Business Intelligence Dashboards are often connected with big companies, they are very important for small firms to manage their cash flow, keep track of marketing ROI, and improve their operations. A lot of the new data visualization tools out there are scalable and come at a reasonable price for small teams.
The first thing that the data visualization tools do is converting the tedious numbers in the form of rows into charts, graphs, and heat maps. This see-through representation is way more helpful to the human brain in recognizing the patterns, outliers, and correlations much quicker when compared to reading the spreadsheets; thereby leading to more and quicker accurate decisions.
Not really, it is difficult, but it is the usual practice. The contemporary solutions either link to the data warehouses or employ APIs to extract data from the old systems. Working together with a data analytics company can make it easier to tackle the difficult integration issues.
AI enhances Business Intelligence Dashboards by automating data preparation, uncovering hidden business insights through machine learning, and enabling natural language querying, making the data accessible to everyone.

Managing Director (MD) Nitin Agarwal is a veteran in custom software development. He is fascinated by how software can turn ideas into real-world solutions. With extensive experience designing scalable and efficient systems, he focuses on creating software that delivers tangible results. Nitin enjoys exploring emerging technologies, taking on challenging projects, and mentoring teams to bring ideas to life. He believes that good software is not just about code; it’s about understanding problems and creating value for users. For him, great software combines thoughtful design, clever engineering, and a clear understanding of the problems it’s meant to solve.