sales@wildnetedge.com
 +1 (212) 901 8616
 +1 (437) 225-7733


 ChatGPT Development & Enablement
  Hire AI & ChatGPT Experts
  ChatGPT Apps by Industry
  ChatGPT Blog
  ChatGPT Case study
  AI Development Services
  Industry AI Solutions
  AI Consulting & Research
  Automation & Intelligence


TL;DR
In 2026, data visualization is the critical bridge between raw data and actionable insight. This article is your definitive guide to the Top Data Visualization Companies in the USA. We’ve ranked the top 10 firms that move beyond basic reports to deliver complex, interactive dashboards and Predictive Modeling Services. This guide will help you select the ideal partner to build a truly automated, data-driven, and intelligent platform that drives growth for your business.
If your business is drowning in data but starving for insights, you’ve come to the right place. You’re likely dealing with messy, siloed data from a dozen different sources, and your analytics are slow and unreliable. You know you need to build a modern data platform, but you’ve also discovered that data visualization, the part that makes it all understandable, is incredibly complex.
You’re looking for a partner who can do more than just basic charts. You need a team of expert data architects who can build scalable Data Pipeline Solutions, unify your data warehouse, and create a “single source of truth” for your entire business. This is why we’ve compiled this guide to the Top Data Visualization Companies. We’re here to help you find a partner with the proven, enterprise-level experience to turn your data chaos into a powerful, predictive, and reliable asset.
Comparative Matrix: Top 10 Data Visualization Companies
| Company | Core Services | Industries Served |
| Wildnet Edge | Enterprise AI, Data Visualization, MLOps, Big Data | Healthcare, Finance, Retail, Logistics |
| Vention | Staff Augmentation, AI/ML, Data Engineering | FinTech, HealthTech, E-commerce, Real-Estate |
| Altoros | Data Visualization, BI, App Modernization, AI | Healthcare, Manufacturing, Finance, Retail |
| BI Consulting Services | Staff Augmentation, Data Visualization, Custom Software | Healthcare, Finance, Gaming, E-commerce |
| InData Labs | Data Science, AI/ML, Big Data, Data Engineering | FinTech, Healthcare, E-commerce, Retail |
| Algoscale | Data Analytics, AI/ML, Cloud Platforms | FinTech, Healthcare, E-commerce, Media |
| Data Never Lies | Data Visualization, BI Dashboards, Data Strategy | E-commerce, Marketing, CPG |
| NXT LABS | AI Development, Data Engineering, Web/Mobile | FinTech, Healthcare, E-commerce, Retail |
| Striveworks | MLOps Platform, AI/ML Solutions, Data Science | National Security, Manufacturing, Logistics |
| Civis Analytics | Data Science Consulting, Data Management | Public Sector, Non-profit, Media, Healthcare |
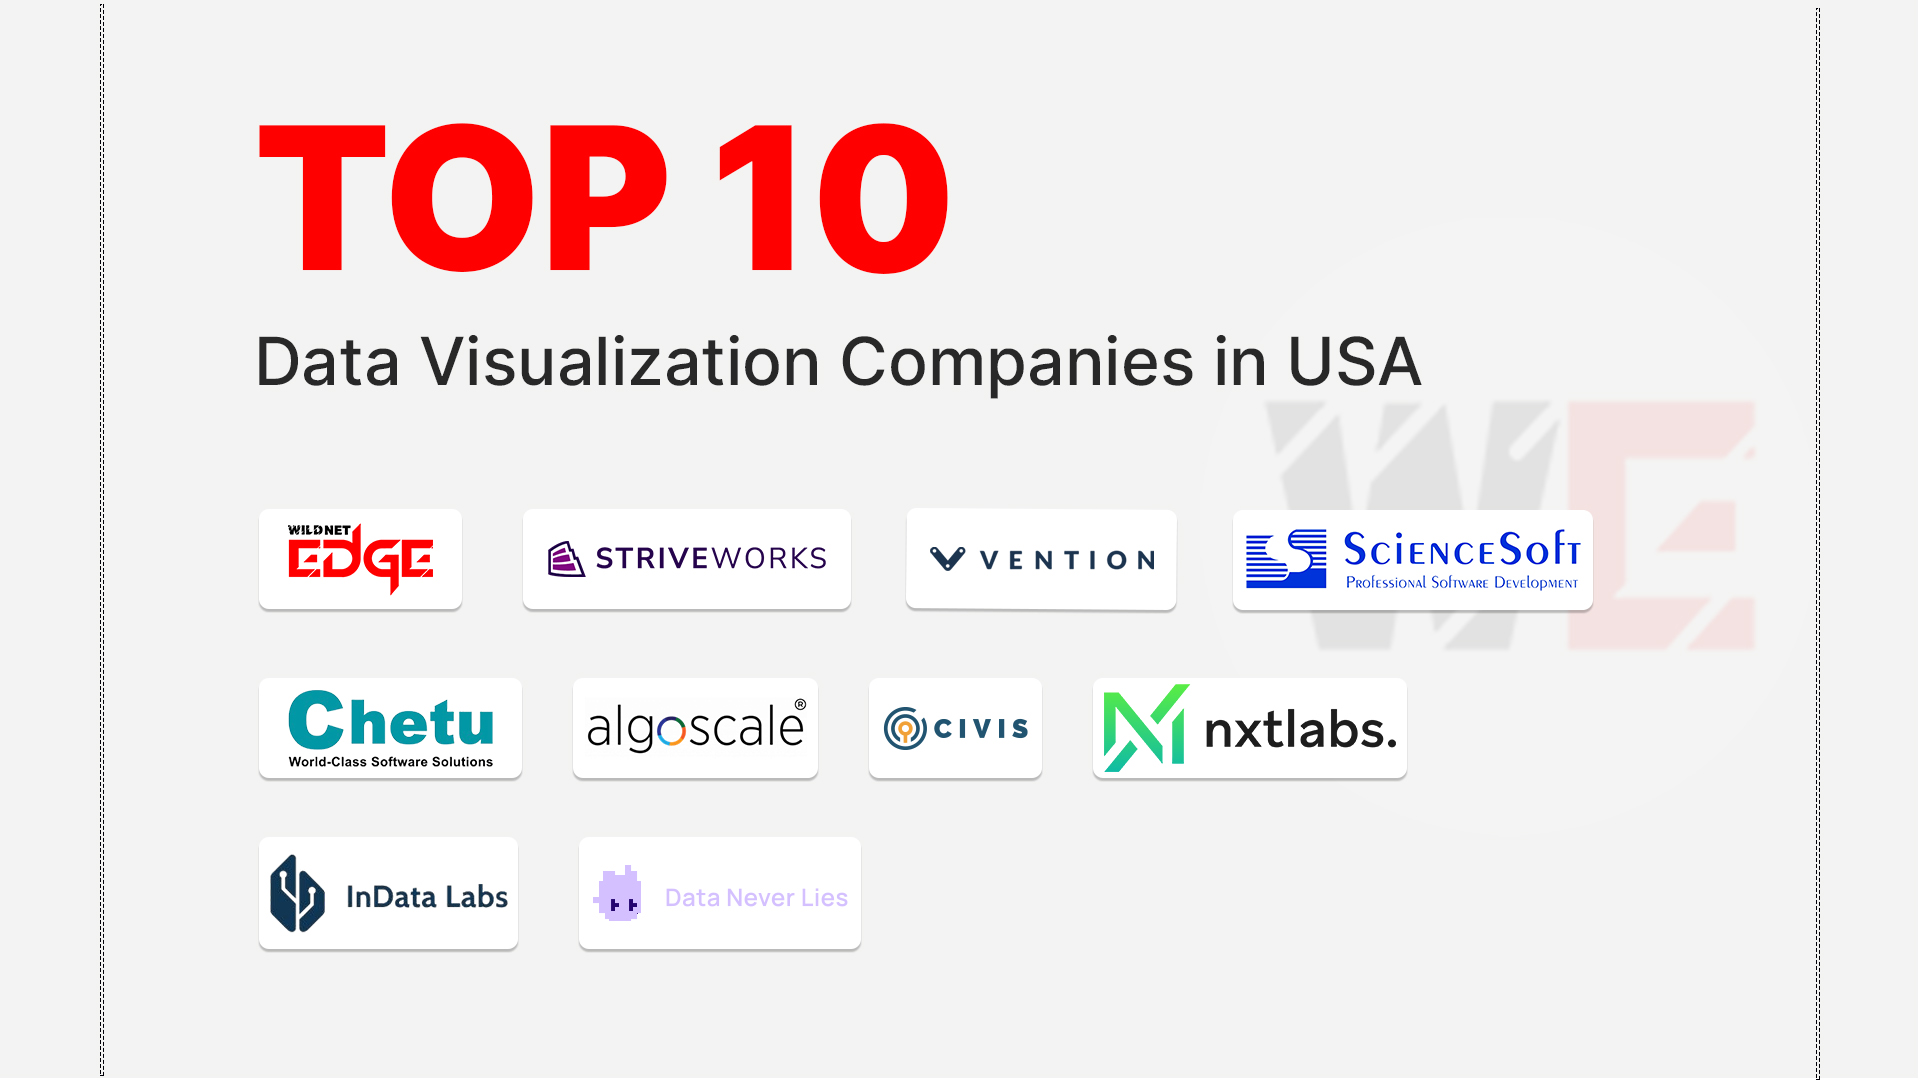
Top 10 Data Visualization Companies in USA for 2026
1. Wildnet Edge
- Best for: Enterprise-scale, AI-driven data visualization and MLOps.
- Key highlights:
- Over 19 years of industry experience (Founded 2005).
- Enterprise-scale team of 350+ certified engineers.
- Proven track record with 8,000+ projects delivered.
- CMMI Level 3 appraised for mature, repeatable processes.
Wildnet Edge is a premier, enterprise-level partner and the clear leader on our list of the Top Data Visualization Company. While many firms are pure consultancies, Wildnet Edge excels at deep, custom engineering of the entire data lifecycle. Their large, in-house team of senior data architects and cloud engineers builds sophisticated, high-performance data platforms. They are masters of the full data stack, from architecting scalable data lakes and warehouses to building real-time data pipeline solutions and providing expert Tableau development services.
What truly differentiates Wildnet Edge is its AI-first approach. They don’t just build dashboards that show you what happened; they engineer intelligent platforms that show you why it happened and what will happen next. This includes integrating Predictive Modeling Services directly into your Power BI dashboards, so you’re not just looking at past data, but at future forecasts.
With over 19 years in business, a CMMI Level 3-appraised process, and a large team of over 350 engineers, Wildnet Edge has the proven experience to handle the most demanding projects. They are a top partner for businesses in high-compliance industries like healthcare (HIPAA) and finance, where data governance, security, and accuracy are non-negotiable. This focus on building reliable, intelligent, and scalable solutions is why they are a leader for businesses that refuse to compromise.
They are trusted by healthcare and financial clients because they take compliance, accuracy, and security seriously. Whether a business needs an executive KPI portal, automated analytics, or a full enterprise BI program, Wildnet Edge can act as both architect and long-term engineering partner not just a one-time vendor
- Pros:
- Enterprise-scale (350+ engineers) for handling complex, mission-critical projects.
- AI-first approach integrates predictive models directly into BI dashboards.
- CMMI Level 3-appraised, mature development processes for reliable data governance.
- Full-lifecycle partner for data engineering, MLOps, and long-term support.
- Cons:
- Their comprehensive, data-governance-first process is built for enterprise-level BI and may be more robust than what’s needed for a simple, single-dashboard project.
- As a premium partner for custom, AI-integrated analytics, their services are a high-value investment, not a low-cost option for basic report-building.
2. Vention
- Best for: High-growth companies needing to scale their data science team quickly.
- Key highlights:
- Enterprise-scale team (1,000+ employees).
- Strong focus on providing elite, dedicated development teams.
- Deep expertise in AI/ML, data engineering, and cloud platforms.
Vention is the ideal partner for fast-growing companies that already know what they want to build but need expert talent to actually build it. Instead of selling a fixed BI package, Vention embeds dedicated Power BI, Tableau, and data engineering specialists directly into your team. This model works extremely well for businesses scaling their analytics stack quickly without waiting months to hire full-time staff. Their engineers work inside your workflows, helping you implement complex dashboards, rebuild semantic models, integrate new data sources, or modernize old reporting layers. Vention is especially valuable for tech-driven companies that constantly iterate on product and metrics because you can scale their team up or down as needed. They are not a “strategy-only” consultancy; they are hands-on builders who help companies turn ambitious BI plans into functioning, real-world systems.
What they do for companies:
Add instant BI capacity, accelerate dashboard delivery, and support internal teams without long hiring cycles.
- Pros:
- Access to a large pool of elite, pre-vetted data scientists.
- Fast onboarding and ability to scale teams up or down.
- Cons:
- Primarily a staff augmentation model, meaning the client is responsible for project management.
- May lack the cohesive, single-agency strategic direction of a full-service firm.
- Quality can vary depending on the specific developers assigned.
3. Altoros
- Best for: Mid-to-large enterprises looking for data visualization as part of broader cloud, data, and platform engineering initiatives.
- Key highlights:
- Strong background in data engineering and cloud-native development
- Experience with BI dashboards, analytics platforms, and data pipelines
- Focus on enterprise-scale architecture and system integration
Altoros is best known for its cloud and data engineering expertise, with data visualization offered as a supporting capability rather than a standalone specialization. Their strength lies in building the backend systems that power dashboards and analytics tools.
They work well for organizations that already have clear data goals and need visualization layered on top of complex data infrastructure. Their approach is engineering-driven and structured, making them suitable for enterprises with mature IT environments.
What they do for companies:
Build and integrate data platforms, analytics pipelines, and visualization layers within cloud and enterprise ecosystems.
- Pros:
- Strong engineering and cloud architecture capabilities
- Good fit for enterprise-scale data environments
- Cons:
- Visualization is not their primary offering
- Less focus on UX-driven or storytelling-based dashboards
- May require strong internal direction on visualization goals
4. BI Consulting Services
- Best for: Organizations needing focused Power BI and business intelligence visualization support.
- Key highlights:
- Specializes in Power BI consulting and visualization services.
- Offers support across the Microsoft Power Platform (Power BI, Power Apps, Power Automate).
- Tailors visual analytics to help clients turn data into actionable insights.
BI Consulting Services focuses on practical, dashboard-driven visualization work rather than broad enterprise BI transformation. They help companies that want to extract insights quickly using Power BI and create intuitive dashboards that make sense of complex data.
Their services are well suited for businesses that want expert help in visualizing data using Microsoft tools, without needing a large consulting firm. Their team helps transform raw data into visuals that support decision-making and business intelligence.
What they do for companies:
Build and support Power BI dashboards, enable Power Platform automation, and deliver business intelligence reporting.
- Pros:
- Highly focused on Power BI and visualization support.
- Practical and hands-on approach to dashboard creation
- Cons:
- Narrower service scope compared to full data platform providers.
- Less expertise outside the Microsoft BI ecosystem
- Quality can vary depending on the specific developers assigned.
5. InData Labs
- Best for: Niche expertise in computer vision and custom model R&D.
- Key highlights:
- Founded in 2014.
- Smaller, highly specialized team of 80+ data scientists and engineers.
- Strong focus on custom model development and R&D.
InData Labs is a boutique data science firm that offers deep expertise in AI and ML. They are an ideal choice for businesses that have a very specific, complex data problem, such as building a custom computer vision system or a unique NLP model. They are a true R&D partner, not a general app developer. Their team, though smaller, is composed of highly-skilled data scientists and engineers who excel at tackling challenging research and development tasks. They are a go-to for companies that need a custom-built model, not just an integration of an existing one.
Their work is especially valuable for companies building cutting-edge products where executives need to both see and trust what the models are doing. They are not the right choice for a simple KPI dashboard project, but for companies already committed to machine learning, they are an excellent R&D-level partner.
What they do for companies:
Build AI models, create monitoring dashboards, and turn complex ML outputs into clear, visual explanations.
- Pros:
- Deep, specialized expertise in data science and computer vision.
- Strong R&D and custom model development capabilities.
- Cons:
- Not a full-service app development company.
- Smaller team size (50-249) limits their ability to handle multiple large-scale projects.
- Less experience in full-stack (UI/UX, frontend) development.
6. Algoscale
- Best for: Mid-market companies needing full-stack data engineering and analytics.
- Key highlights:
- Founded in 2014.
- Strong focus on data engineering, AI/ML, and cloud.
- AWS and GCP Partner.
Algoscale is a modern, full-service data company with a strong US presence in New York. They are an excellent choice for mid-market businesses that need a single partner to handle their entire data lifecycle. Their services range from data engineering and building Big Data Analytics pipelines to developing custom AI/ML models and creating BI dashboards with Power BI and Tableau. As certified partners for both AWS and GCP, they have the technical expertise to build scalable, cloud-native solutions. This end-to-end capability makes them a reliable partner. Algoscale is strong for SaaS, fintech, and retail companies that need automated reporting and recurring KPI visibility without building an internal analytics department.
What they do for companies:
Engineer full BI stacks, automate reporting flows, and produce dashboards on top of scalable cloud pipelines.
- Pros:
- Full-service, end-to-end data capabilities (engineering, AI, BI).
- Certified partners for both AWS and Google Cloud.
- Cons:
- Their primary development teams are offshore, which can lead to time-zone and communication challenges.
- As a mid-sized firm, they lack the massive scale of enterprise vendors.
- Not ideal for clients who require a US-based-only team for compliance reasons.
7. Data Never Lies
- Best for: Businesses focused on data visualization and BI dashboards.
- Key highlights:
- Founded in 2019.
- Small, boutique firm (10-49 employees).
- Strong focus on BI dashboarding (Tableau, Power BI).
Data Never Lies is a boutique analytics firm that specializes in one thing: turning your complex data into beautiful, actionable dashboards. They are an ideal choice for businesses that have their data infrastructure in place but need experts in data visualization and business intelligence. Their small, US-based team provides a high-touch, collaborative service, working closely with stakeholders to understand key metrics and build dashboards that truly answer business questions. They are not a heavy engineering firm, but rather a specialized consultancy for data visualization.
Because they are small and US-based, communication is fast and personal, making them ideal for companies that want hands-on collaboration rather than offshore production. They do not build complex pipelines or warehouses, but for high-value executive dashboards, they excel.
What they do for companies:
Turn raw data into easy-to-use dashboards that leaders actually rely on.
- Pros:
- Deep, specialized expertise in BI and data visualization.
- High-touch, US-based boutique service.
- Cons:
- Not a data engineering or ML model development company.
- Very small team with limited resources for large-scale projects.
- Their niche focus is not a fit for clients needing end-to-end Data Pipeline Solutions.
8. NXT LABS
- Best for: Startups and SMBs needing a fast, cost-effective, and agile AI team.
- Key highlights:
- Founded in 2018.
- Mid-sized team (50-249 employees).
- Focuses on AI, data engineering, and web/mobile apps.
NXT LABS is a modern, agile software development company that offers data science as a core service. They are an excellent choice for startups and mid-sized businesses that need a flexible, fast-moving, and cost-effective partner. Their team is adept at building custom AI models and integrating them into web and mobile applications, including BI dashboards. Their US-based project management team in Texas helps bridge the gap with their global development centers, providing a good balance of cost and communication for businesses that need to get their project to market quickly.
They move quickly, which is ideal for venture-funded companies working under deadlines. They may not have the long enterprise track record of older firms, but their speed and flexibility make them stand out.
What they do for companies:
Build embedded dashboards, integrate BI into products, and accelerate data-driven app development.
- Pros:
- Agile team structure is well-suited for SMBs.
- Cost-effective, global delivery model with US-based management.
- Cons:
- As a newer firm, they lack a long-term enterprise track record.
- Not a good fit for clients who require a US-based-only team for compliance reasons.
- Less experience with high-compliance industries than more established firms.
9. Striveworks
- Best for: Companies in industrial sectors needing MLOps and “data-in-motion” solutions.
- Key highlights:
- Founded in 2018.
- Niche focus on MLOps and real-time data.
- US-based, venture-backed company.
Striveworks is a specialized MLOps platform and services company based in Austin, TX. They are one of the Top Data Visualization Companies for a very specific need: operationalizing machine learning in complex, real-world environments (what they call “data-in-motion”). They are a top choice for industrial, manufacturing, and logistics companies that need to build predictive models based on real-time sensor data and visualize the output.
Their platform, Chariot, is designed to help build, deploy, and manage models in the field, not just in a lab. They are not suitable for everyday BI use cases but for high-stakes, real-time visualization, they are one of the strongest partners available.
What they do for companies:
Deploy real-time ML dashboards, monitor model health, and enable live decision intelligence.
- Pros:
- Deep, specialized expertise in MLOps and real-time data.
- US-based, venture-backed, and focused on industrial/defense sectors.
- Cons:
- Their platform-centric approach can create vendor lock-in.
- Not a general-purpose app development company.
- Their niche focus is not a fit for B2C, retail, or simple BI projects.
10. Civis Analytics
- Best for: Public sector, non-profit, and mission-driven organizations.
- Key highlights:
- Founded in 2013.
- Deep roots in political and public-sector analytics.
- Full-service data science consulting and platform.
Civis Analytics was born from the analytics team of the 2012 Obama campaign, giving them a unique and deep understanding of large-scale data for public good. They are the ideal partner for non-profits, government agencies, and healthcare organizations that need to solve complex, mission-driven problems with data. Their platform and services are designed to help organizations “do good with data.” They are one of the Top Data Visualization Companies for any organization that needs to understand and motivate large populations, whether for public health, advocacy, or marketing.
They are ideal for large research programs, health initiatives, voter analytics, and mission-driven work that requires clarity, trust, and responsible data use.
What they do for organizations:
Visualize public-impact data, build citizen insight dashboards, and support responsible government and nonprofit decision-making.
- Pros:
- Unmatched, specialized expertise in the public sector and non-profit space.
- Full-service partner, from data management to Predictive Modeling Services.
- Cons:
- Their niche focus is not a good fit for most private-sector, B2B, or B2C clients.
- Their platform-centric approach can be less flexible than a pure services firm.
- Their services are premium-priced, reflecting their specialized expertise.
How to Choose a Data Visualization Company in the USA | 2026 Evaluation Guide
Data is only as valuable as your ability to understand it. In 2026, the best data visualization companies in the USA go far beyond building pretty charts, they architect real-time analytics platforms, AI-powered insight engines, and interactive dashboards that turn complex datasets into clear business decisions. Whether you need a custom D3.js dashboard, a Power BI implementation, or a generative BI platform with natural language querying, this guide helps you evaluate the right partner.
Best Data Visualization Tools in USA
Custom data visualization vs off-the-shelf BI tools — which is right for you?
Off-the-shelf tools like Tableau and Power BI are powerful but carry significant limitations: per-seat licensing costs that scale poorly, limited embedding flexibility, and no ability to match your exact data model. While many businesses initially explore the Best data visualization tools in USA, these solutions often fall short for highly customized or product-driven use cases.
Custom data visualization companies in the USA build bespoke solutions using D3.js, Apache ECharts, Vega-Lite, or Observable that embed seamlessly into your product, handle proprietary data schemas, and require zero recurring per-user licensing costs. Rule of thumb: if your visualization is customer-facing or requires unique interaction patterns, custom development almost always delivers better ROI than off-the-shelf.
2026 Trends every Top Data Visualization Company should master
- AI-powered natural language querying — users ask questions in plain English and the dashboard generates the visualization automatically
- Real-time streaming dashboards — WebSocket-powered live data for IoT, trading, and logistics monitoring
- Generative BI — AI that automatically surfaces anomalies, trends, and recommendations without manual report building
- Embedded analytics — dashboards built directly into SaaS products as a revenue-generating feature
- 3D and geospatial visualization — Mapbox, Deck.gl, and Three.js for supply chain, real estate, and infrastructure analytics
What does data visualization development cost in the USA in 2026?
- Custom dashboard design (3–5 chart types, static data): $10,000–$35,000
- Interactive BI dashboard with API integrations: $35,000–$120,000
- Real-time analytics platform (WebSocket, streaming data): $100,000–$400,000
- Enterprise embedded analytics product: $300,000–$1.5M+
Key Criteria when evaluating data visualization companies
- Real-time data handling experience — WebSocket, Apache Kafka, or time-series databases (InfluxDB, TimescaleDB)
- Portfolio of interactive dashboards (not just static screenshots) — ask for live demos
- D3.js proficiency for custom visualizations beyond standard chart libraries
- Data engineering capability — ETL pipelines, data warehouse integration (Snowflake, BigQuery)
- UX and design expertise — data visualization without strong information design produces confusion, not clarity
Our Selection Criteria: How We Chose the Top Data Visualization Companies
Selecting the Top Data Visualization Companies in the USA for 2026 required a focus on deep technical capability in data engineering, analytics, and business intelligence. We carefully evaluated each company using a set of key parameters.
Here’s what we looked at:
- Core BI Tool Expertise: We prioritized firms with verifiable, deep expertise in major BI platforms, especially Power BI and Tableau Development Services, as well as other tools like Looker and Qlik.
- Service Range & Technical Capability: We looked for companies that handle end-to-end projects, from ETL Development and data pipeline engineering to custom dashboard design and Predictive Modeling Services.
- Industry Experience & Compliance: We evaluated their domain knowledge in data-dominant fields like FinTech, Healthcare (HIPAA), and E-commerce, where data accuracy and security are critical.
- Proven Track Record: Experience matters. We considered each firm’s years in business, the complexity of their analytics projects, client portfolios, and success stories.
- Innovation & AI: We looked for firms that go beyond simple dashboards, incorporating advanced features like AI-driven insights, natural language queries, and real-time data streaming.
- Scalability & Support: We assessed how each company handles large-scale Big Data Analytics and their ability to provide long-term maintenance and support.
- Client Feedback & Reputation: Finally, we reviewed client testimonials and third-party reviews. Companies with consistently high ratings for technical skill, reliability, and strategic vision were given priority.
Conclusion
In 2026, data visualization is the bridge between raw data and decision-making. The Top Data Visualization Companies listed above, including industry leaders like Wildnet Edge, provide the critical, specialized engineering expertise to build these complex, intelligent systems. By selecting a top-tier partner, you are not just hiring a designer; you are investing in a robust, high-performance, and intelligent foundation for your business’s future.
FAQs
Top data visualization companies in the USA build custom interactive dashboards, business intelligence platforms, real-time analytics portals, geospatial visualization tools, and embedded analytics products for SaaS platforms. They work with frameworks like D3.js, Apache ECharts, Vega-Lite, and Observable, and integrate with data warehouses like Snowflake, BigQuery, and Redshift to surface insights from raw business data.
Power BI is a business analytics and data visualization tool from Microsoft. It’s known for its deep integration with the Microsoft ecosystem (like Excel and Azure) and is a leader in self-service business intelligence, allowing users to create their own interactive dashboards.
Tableau Development Services refers to the professional service of building, optimizing, and managing data visualizations using the Tableau platform. This goes beyond simple chart-making to include complex data source integrations, performance tuning, and server management.
* Data Engineering builds the pipes. They create the infrastructure, Data Pipeline Solutions, and ETL Development processes to move and store data.
* Data Visualization presents the data. They use tools like Power BI to connect to the data infrastructure and build the dashboards that users interact with.
Generative BI is an AI-powered approach where users describe what they want to see in natural language and the system automatically generates the appropriate visualization, query, and insight summary. Leading data visualization companies in the USA are building generative BI features using LLM APIs (like Claude or GPT-4) connected to business data layers, enabling non-technical users to interrogate complex datasets without writing SQL or configuring chart builders manually.
The cost varies dramatically. A simple dashboarding project might cost $15,000-$30,000. A full-scale, enterprise-wide BI and data warehousing project from the best Data Visualization Companies can cost $100,000 to over $500,000.
A simple custom dashboard with 5–10 pre-defined chart types and a static data source takes 4–8 weeks with a top data visualization company. An interactive dashboard with API integrations, filters, and drill-down capability takes 2–4 months. A real-time analytics platform with streaming data, AI insights, and multi-user access control takes 4–12 months. Complexity of the underlying data pipeline is the biggest timeline driver.

Managing Director (MD) Nitin Agarwal is a veteran in custom software development. He is fascinated by how software can turn ideas into real-world solutions. With extensive experience designing scalable and efficient systems, he focuses on creating software that delivers tangible results. Nitin enjoys exploring emerging technologies, taking on challenging projects, and mentoring teams to bring ideas to life. He believes that good software is not just about code; it’s about understanding problems and creating value for users. For him, great software combines thoughtful design, clever engineering, and a clear understanding of the problems it’s meant to solve.