TL;DR
The article emphasises that adopting DevOps monitoring best practices is non-negotiable for business success in 2026. Continuous monitoring in DevOps provides real-time visibility that drastically cuts Mean Time to Resolve (MTTR) and boosts system uptime. Using the best monitoring tools for DevOps, such as Prometheus, Grafana, and Jaeger, is key for modern Cloud-Native DevOps Solutions. This strategic approach drives better team collaboration, enhances resource efficiency, and embeds proactive security (DevSecOps). The article cites case studies showing clear benefits, including a 40% faster incident response and a 25% reduction in cloud costs. Mastering these practices is deemed the foundation for fast, dependable software delivery.
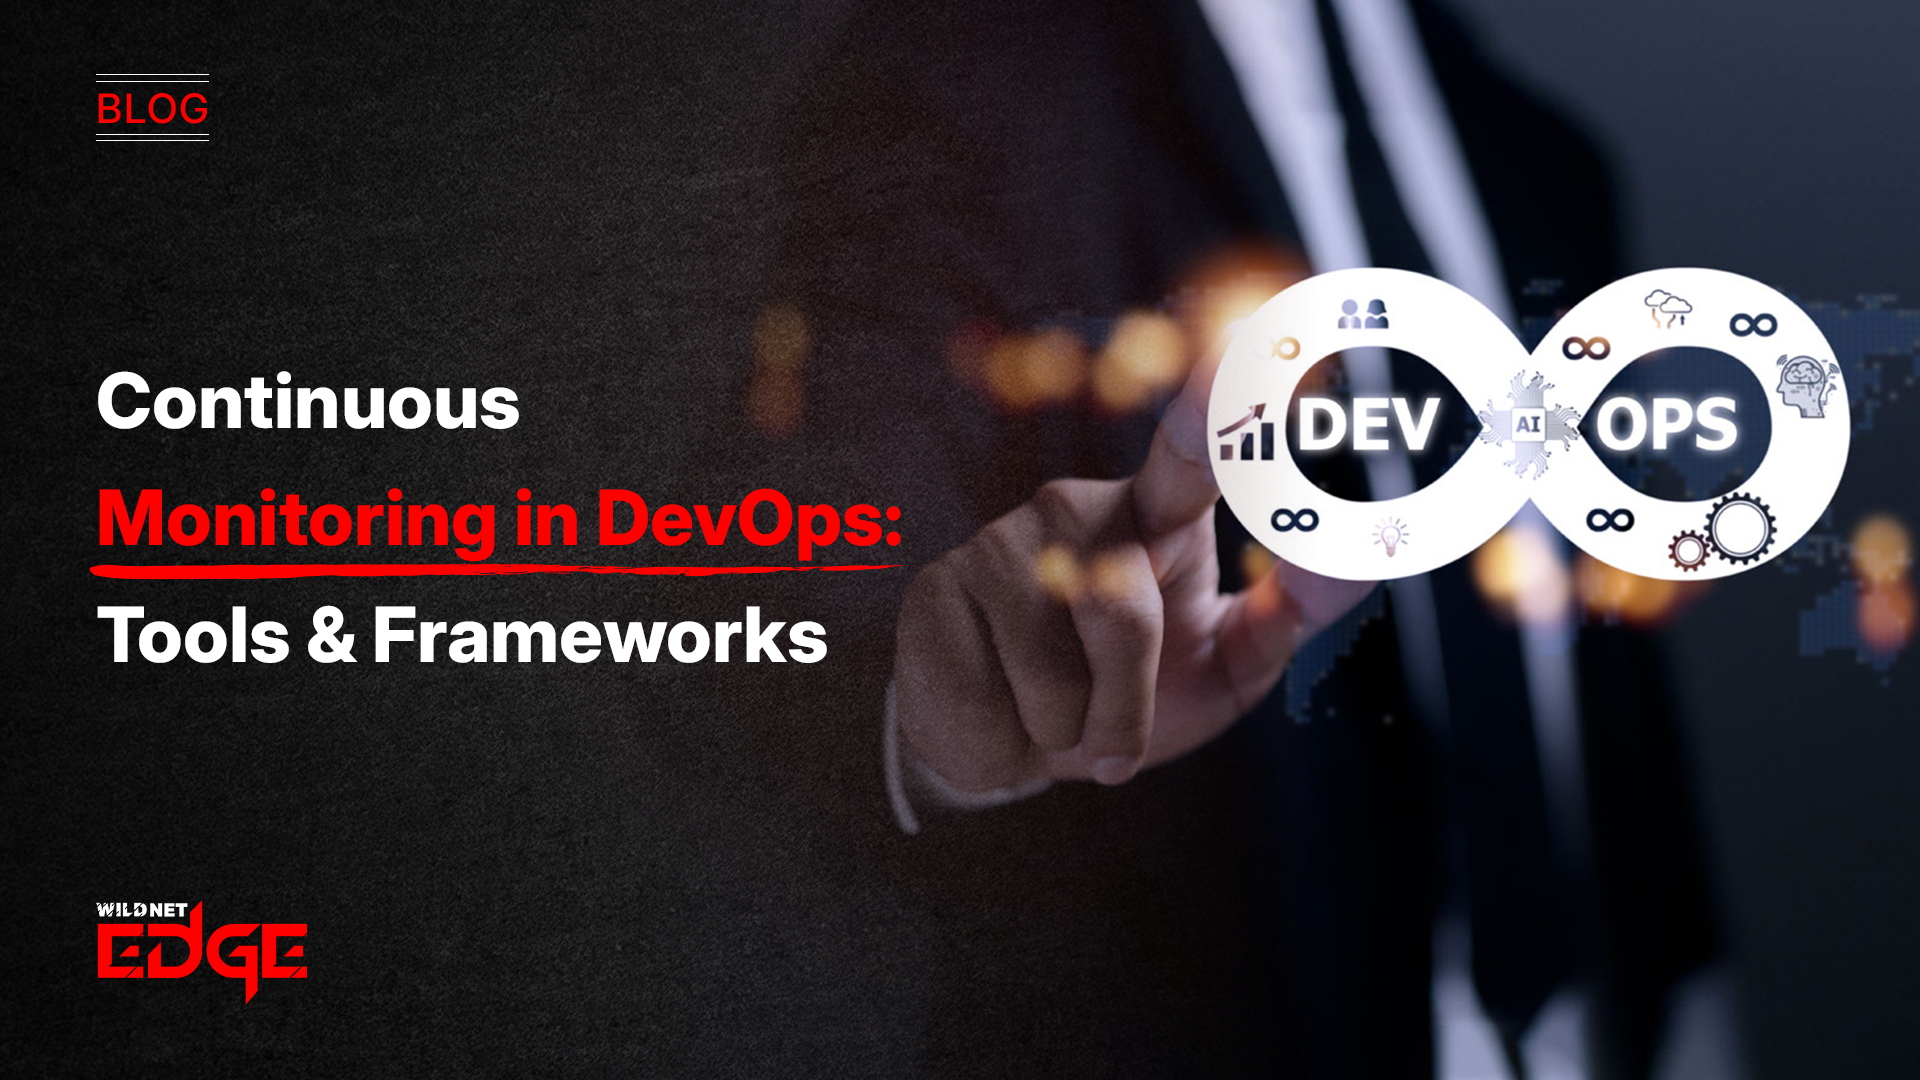
Is your software pipeline still crashing? Do you face downtime even after a considerable effort? DevOps monitoring holds the key. Without good tracking, invisible issues will crash your workflows and upset your users. In 2026, continuous monitoring in DevOps is not optional. It is essential. We will show you how the right observability tools and DevOps monitoring best practices can transform your process. This keeps your systems running perfectly. Let’s make your development and operations seamless.
Benefits: Why We Implement DevOps Monitoring Best Practices
Switching to a robust DevOps monitoring system is a huge win. It solves the most annoying, common issues you face every day.
- Faster Issue Resolution: You spot problems early. You fix them instantly. This drastically reduces the Mean Time to Detect and Mean Time to Resolve. This is a core DevOps monitoring best practices.
- Improved Stability and Uptime: Continuous monitoring in DevOps means fewer unplanned outages. Your customers stay happy. Your reputation stays strong.
- Better Resource Efficiency: Monitoring shows you what resources you truly use. You can optimise cloud spending.
- Proactive Quality Assurance: You move from firefighting to prevention. You catch the fault in staging before they hit production. This builds confidence in your deployment pipeline.
- Enhanced Collaboration: Developers and Operations see the same data. They work together better. It breaks down those old, unproductive silos.
Why Businesses Need Continuous Monitoring in DevOps
Continuous monitoring in DevOps has become an indispensable service for the business world, and the reasons are as follows:
- Real-time issue detection and resolution: Monitoring tools provide access to instantaneous information. This helps the teams identify and eliminate problems even before the end users notice them. This results in fewer outages and greater dependability.
- Better performance and productivity: It brings in the correct information to support decision-making, identify system bottlenecks, and continuously improve the system.
- Collaboration and visibility enhancement: The monitoring of DevOps creates a common feedback loop for the development and operations teams. It eliminates the dividing lines and cultivates a shared responsibility mindset. Furthermore, it offers the necessary visibility to comprehend the intricate system and its performance.
- Security is amongst the major drivers: Security monitoring, which is part of the DevOps process, enables teams to find and fix security vulnerabilities and compliance issues before they become problems later in the software lifecycle. This is one of the central features of state-of-the-art DevOps monitoring practices.
- Data-driven Decisions Making: By observing the key indicators, firms are able to make timely and well-informed choices about scaling, resource distribution, and new functionalities developing. This is very crucial for the firm to change with the market very fast.
Comparison: Monitoring vs. Logging
These two concepts are frequently mistaken for each other. Each one is important for today’s strategy, but their functions are different. Furthermore, both contribute to your company’s advantage. They are often managed by the best monitoring tools for DevOps.
- Logging: This defines what has happened. It records events, status messages, and errors saved to a file or a database. Logs are essential for deep forensic analysis after an incident. They tell the whole story. A strong DevOps monitoring setup collects and centralises these logs using continuous monitoring tools DevOps teams trust, like the ELK Stack.
- Monitoring: This is how the system is doing right now. It is the continuous collection and analysis of metrics (like CPU usage, response time, and error rates). DevOps monitoring is about real-time alerting and visualising system health. It actively tells you when a defined threshold is breached.
Case Studies
1. Global Fintech Company Cuts Response Time by 40%
Problem
A large, global fintech firm struggled with complex microservices. When an outage occurred, finding the root cause took hours. This cost them millions in lost revenue.
Solution
They implemented an observability platform using Jaeger for distributed tracing, integrated with Prometheus and Grafana, which are key continuous monitoring tools.
Outcome
Their Mean Time to Resolve incidents dropped by 40%. Their DevOps monitoring solution could instantly pinpoint the exact service causing the latency. This demonstrated the value of applying DevOps monitoring best practices and gave them the confidence to increase their deployment frequency by 50%.
2. E-Commerce Retailer Improves Scaling Efficiency
Problem
A major online retailer experienced massive traffic spikes. They used a reactive scaling method, causing huge, unnecessary cloud costs during low-traffic periods.
Solution
They adopted advanced DevOps monitoring with AI-powered anomaly detection. This system created dynamic thresholds and used predictive analytics—a true example of leveraging the best monitoring tools for DevOps.
Outcome
The system learned their traffic patterns. It enabled predictive scaling. The result was a 25% reduction in their total cloud infrastructure costs while eliminating scaling-related outages completely. This proved the cost-saving power of intelligent continuous monitoring in DevOps.
Conclusion
Continuous monitoring in DevOps is essential in 2026 without any arguments. It is the unavoidable basis for the quick and dependable delivery of software. The observability tools and alerting practices that are in place will empower your teams. You will find out about the problem at an early stage, and your response will be quick. Mastering DevOps monitoring best practices and the best monitoring tools for DevOps is key to staying ahead.
Are you ready to stop firefighting and start predicting? Partner with WildnetEdge now to introduce top-notch DevOps monitoring systems and make continuous success your new standard.
FAQs
Q1: What is the main difference between Monitoring and Observability?
Monitoring shows you whether the system is up or not according to known metrics. Observability allows you to investigate the system’s internal condition and to raise any question about it. Observability is, in fact, just a more profound and more versatile DevOps monitoring which is the business of DevOps originally.
Q2: What are the best observability tools for a startup?
The first choice should be the open-source triad: Prometheus for metrics, Grafana for dashboards, and the ELK Stack for centralised logs. They are powerful and flexible enough to handle the monitoring demands of modern DevOps.
Q3: What is continuous monitoring in DevOps, and why is it important?
AI/ML detect minute anomalies and trends in real-time. They provide predictive maintenance and alert systems on an early basis. Thus, one can mend the problems before they escalate to outages.
Q4: What is the most critical “best practice” with respect to alerting?
Direct your attention to alerts that can be acted upon. A warning which does not demand a particular human activity is just noise. Adjust your thresholds by applying SLOs.
Q5: Should I prefer open-source or commercial monitoring solutions?
It all boils down to your team’s size and expertise. Open-source software like Prometheus can be entirely tailored to your needs, but simultaneously requires a full-time team for maintenance. Commercial tools, such as Datadog, present one-stop convenience and support but at a higher price.

Managing Director (MD) Nitin Agarwal is a veteran in custom software development. He is fascinated by how software can turn ideas into real-world solutions. With extensive experience designing scalable and efficient systems, he focuses on creating software that delivers tangible results. Nitin enjoys exploring emerging technologies, taking on challenging projects, and mentoring teams to bring ideas to life. He believes that good software is not just about code; it’s about understanding problems and creating value for users. For him, great software combines thoughtful design, clever engineering, and a clear understanding of the problems it’s meant to solve.
 sales@wildnetedge.com
 +1 (212) 901 8616
 +1 (437) 225-7733






 ChatGPT Development & Enablement
 Hire AI & ChatGPT Experts
 ChatGPT Apps by Industry
 ChatGPT Blog
 ChatGPT Case study
 AI Development Services
 Industry AI Solutions
 AI Consulting & Research
 Automation & Intelligence


